Hi
Sorry for my long absence. I was quite busy and still have lots to do, but i found some time for Terasology lately and i hope, i can do some more work.
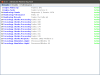
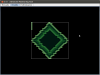
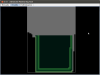
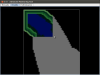
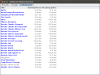
While experimenting around with stackable chunks i created an advanced monitoring tool for Terasology. It is cappable of monitoring game related threads activity and chunks. It displays the running mean and decaying spikes from performance monitoring, too.
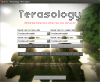
The advanced monitor resides in its own window. It can be enabled/disabled throught "settings" -> "advanced". There you can activate the option to show the monitor window at startup of Terasology. Currently, this is the only way to access the monitor. If you change these settings, they will only be applied after you restarted the game. Advanced monitoring is disabled by default.
All that stuff was developed while playing around with stackable chunks and i just commited it to the same branch. I've extracted the monitoring related code and put it into its own branch now:
https://github.com/mbrotz/Terasology/tree/monitoring
While advanced monitoring is activated, there might be a negative performance impact. When disabled, there should be no noticeable impact on performance, though.
Would be nice, to see this in the main branch!") What do you guys think?
What do you guys think?
Panserbjoern
Sorry for my long absence. I was quite busy and still have lots to do, but i found some time for Terasology lately and i hope, i can do some more work.
While experimenting around with stackable chunks i created an advanced monitoring tool for Terasology. It is cappable of monitoring game related threads activity and chunks. It displays the running mean and decaying spikes from performance monitoring, too.
The advanced monitor resides in its own window. It can be enabled/disabled throught "settings" -> "advanced". There you can activate the option to show the monitor window at startup of Terasology. Currently, this is the only way to access the monitor. If you change these settings, they will only be applied after you restarted the game. Advanced monitoring is disabled by default.
All that stuff was developed while playing around with stackable chunks and i just commited it to the same branch. I've extracted the monitoring related code and put it into its own branch now:
https://github.com/mbrotz/Terasology/tree/monitoring
While advanced monitoring is activated, there might be a negative performance impact. When disabled, there should be no noticeable impact on performance, though.
Would be nice, to see this in the main branch!
What do you guys think?Panserbjoern